
1. Page layout
Message Data Viewer has two sections.- Settings. Set the date range, metrics, grouping, and filters.
- Data table. Review the results based on the metrics, groups, and filters you select.
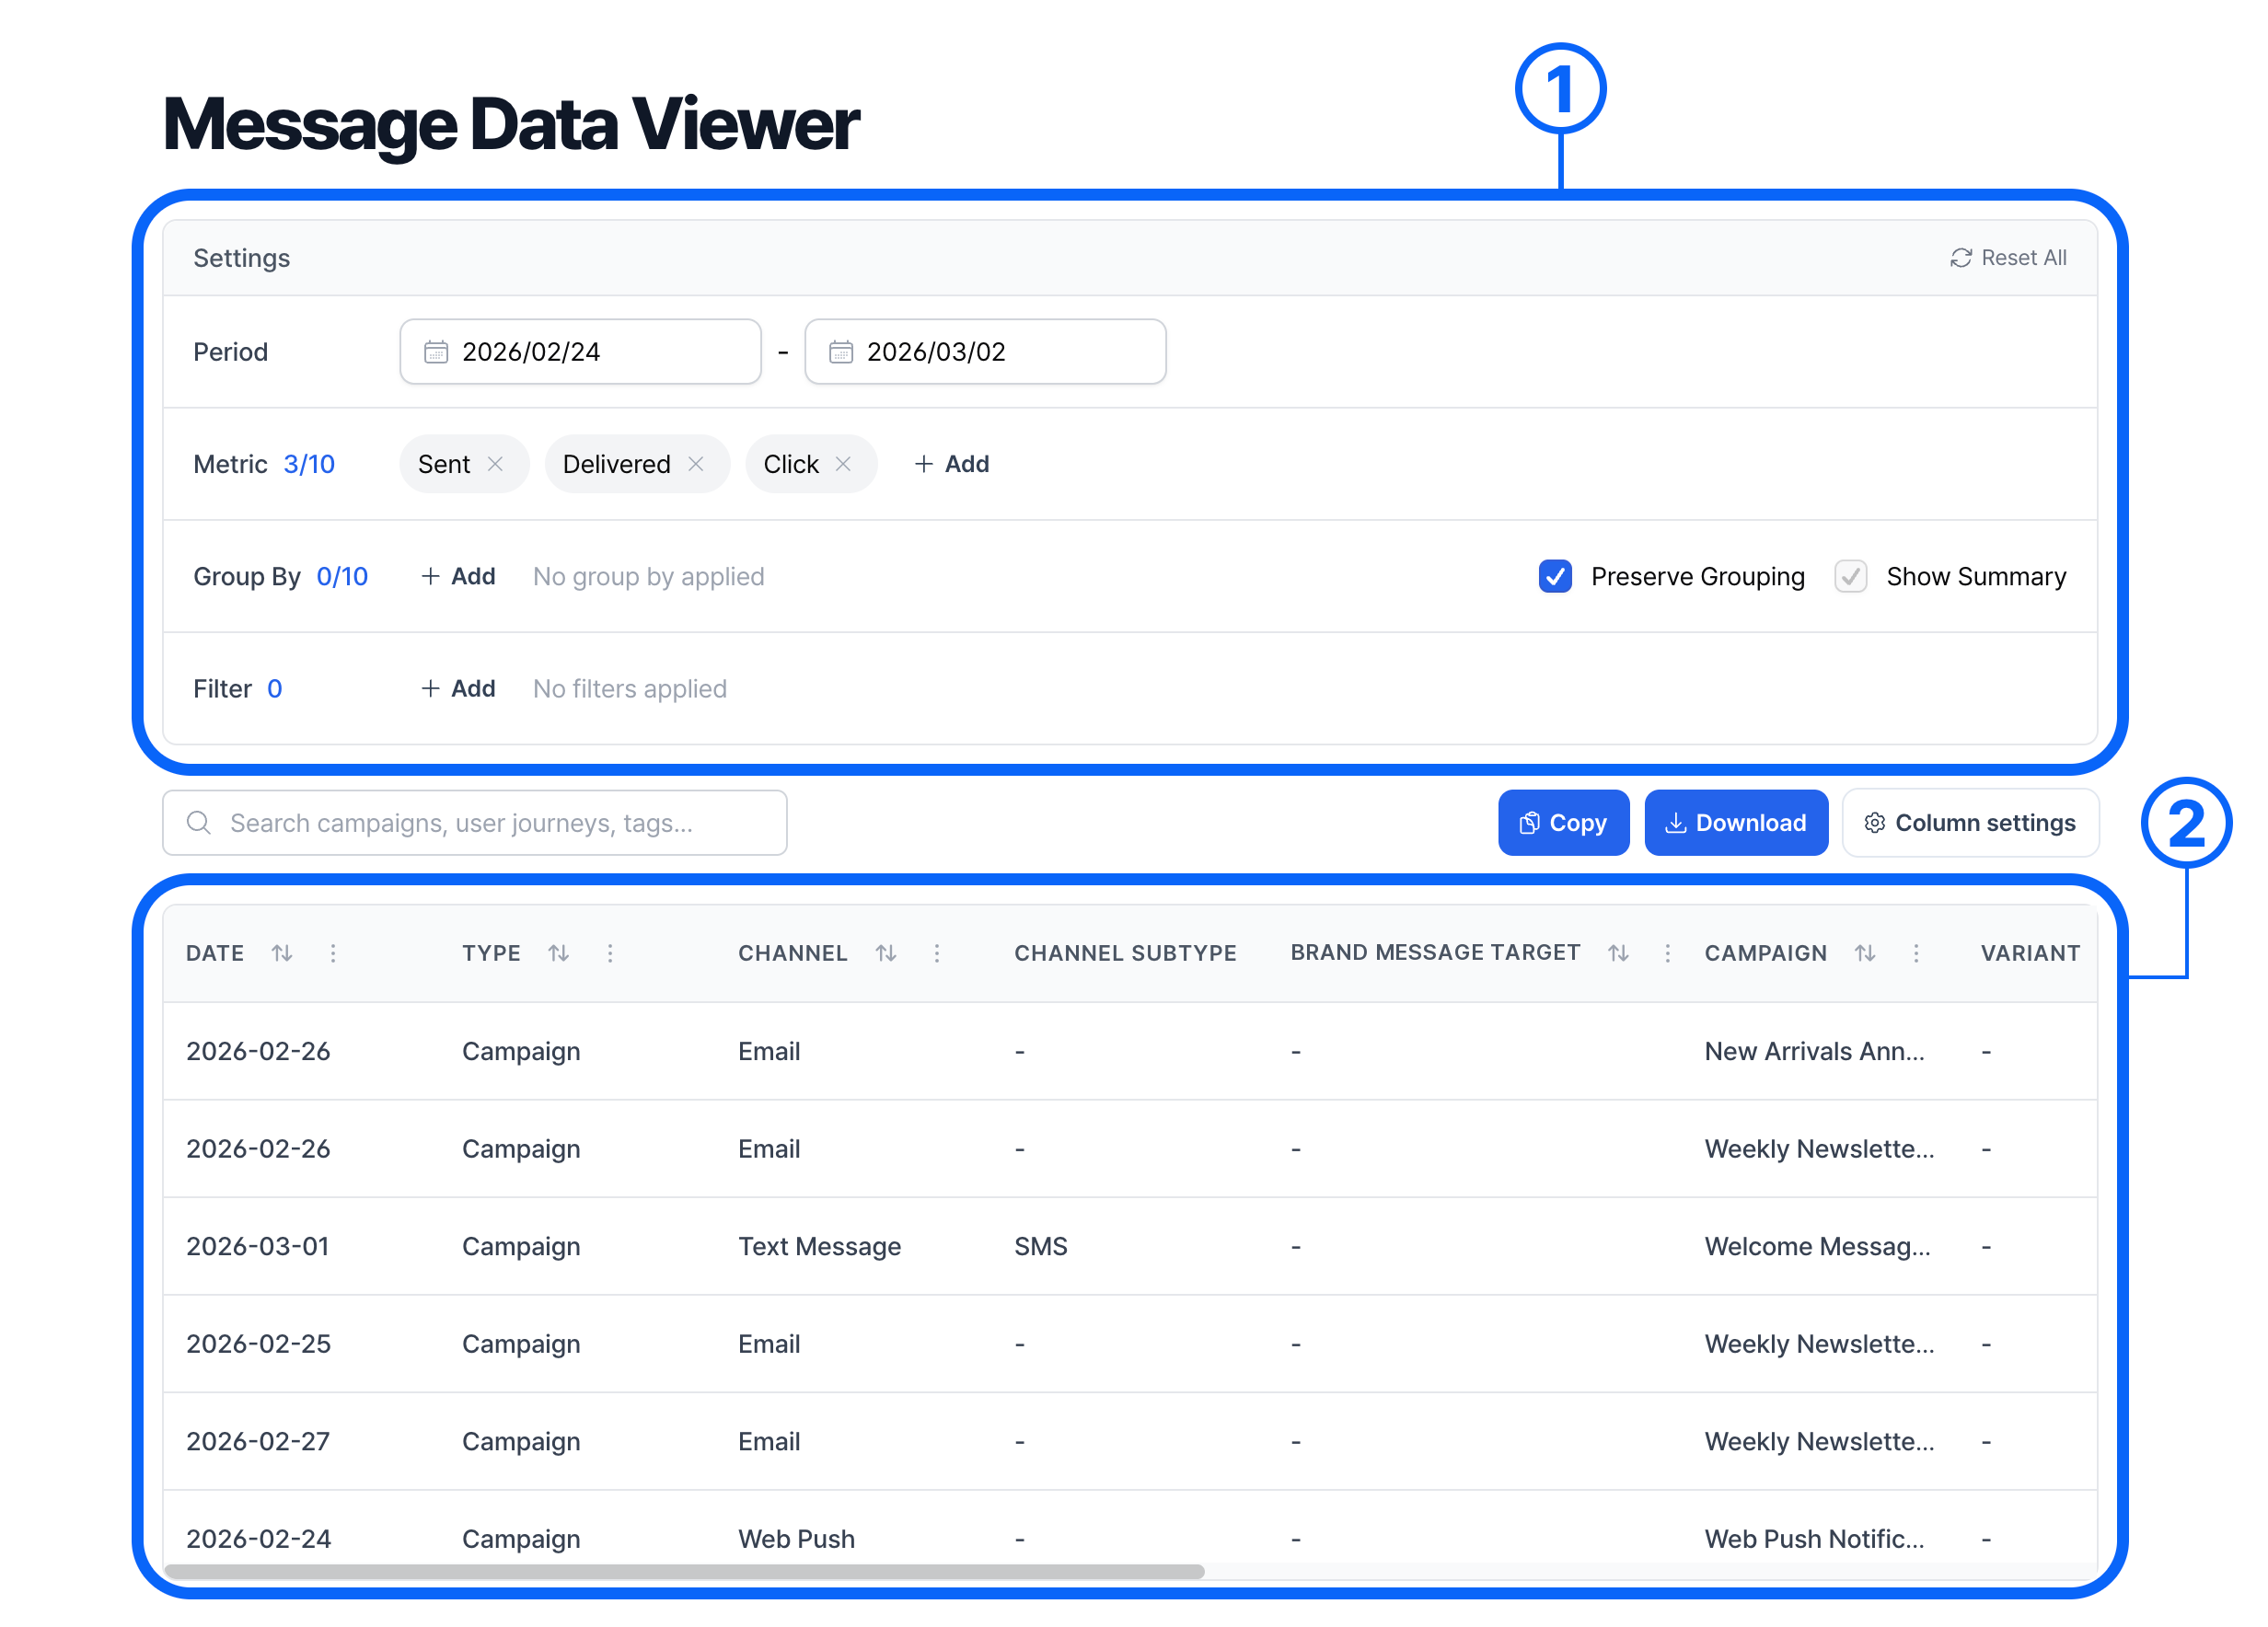
2. Settings
2-1. Period
Choose a start and end date for the report. Click either date field to open the date picker.The table does not include data for today.
2-2. Metrics
Select up to 10 metrics to display as columns in the table.- Sent. For messaging channels, this counts successful sends. For in-app and web popups, it counts impressions.
- Failed. The number of failed sends.
- Delivered. The number of messages that reached recipients, such as push notifications or emails.
- Click. The number of clicks on supported messages, such as app push notifications, emails, or a popup’s main button.
- Conversions. Metrics based on a specific conversion event. The suffix identifies the metric type. For example,
Purchase_completed(T) is the total conversion count for that event.- (T). Total conversions.
- (D). Direct conversions.
- (S). Conversion revenue.
× next to an added metric to remove it.
2-3. Group by
Use Group By to break down results by up to 10 fields.- Date. The calendar date.
- Type. Campaign or user journey.
- Channel. The messaging channel, such as app push, Kakao Alimtalk, or email.
- Channel Subtype. A category within a channel, such as the wide image format for Kakao Brand Message.
- Brand Message Target. The Kakao Brand Message target group (
I,M, orN). - Campaign. The campaign name.
- Variant. The A/B test group name.
- User Journey. The user journey name.
- Journey Node. The name of a message node in a user journey.
- Tag. A campaign tag.
2-4. Filters
Use filters to show only the rows that match your criteria. Click Add to open the Filter type and Condition dropdowns. Choose a field such as Channel, Campaign, or Tag. Set the date range under Period. Choose a condition.is. Matches any of the values you add.is not. Excludes rows that match any selected value. When filtering by Tag, rows without tags remain visible.contains. Includes the specified text.does not contain. Excludes rows containing the specified text. When filtering by Tag, rows without tags remain visible.exists. Shows rows with a value for the selected field.does not exist. Shows rows with no value for the selected field.
2-5. Reset settings
Click Reset All in the upper right of the settings section to restore the default period, metrics, grouping, and filters.3. Data table
3-1. Search
Use the search bar above the table to search visible name and tag columns. To search by campaign or user journey name, add the corresponding field in Group By and make sure its column is visible.3-2. Sort columns
Click the arrow icon (↑↓) in a column heading to sort that column in ascending or descending order.3-3. Column options
Click⋮ at the right of a column header.
- Select Hide column to remove it from the table.
- Select Decimal places… to change the number of decimal places shown for numeric values.